Tracers for debugging and program exploration
Proposal paper at PLATEAU 2026.
Keywords: tracing, program visualization, programming tools
© 2026 Copyright Shardul Chiplunkar and Clément Pit-Claudel. This work is licensed under a Creative Commons Attribution 4.0 International License (CC-BY 4.0).
PDF version also available on the arXiv.
Programmers often use an iterative process of hypothesis generation (“perhaps this function is called twice?”) and hypothesis testing (“let’s count how many times this breakpoint fires”) to understand the behavior of unfamiliar or malfunctioning software. Existing debugging tools are much better suited to testing hypotheses than to generating them. Step debuggers, for example, present isolated snapshots of the program’s state, leaving it to the programmer to mentally reconstruct the evolution of that state over time. We advocate for a different approach: building a debugging and program-exploration tool around a trace, or complete history, of the program’s execution. Our key claim is that the user should see every line as executed (in time order) rather than as written (in syntax order). We discuss design choices, preliminary results, and interesting challenges.
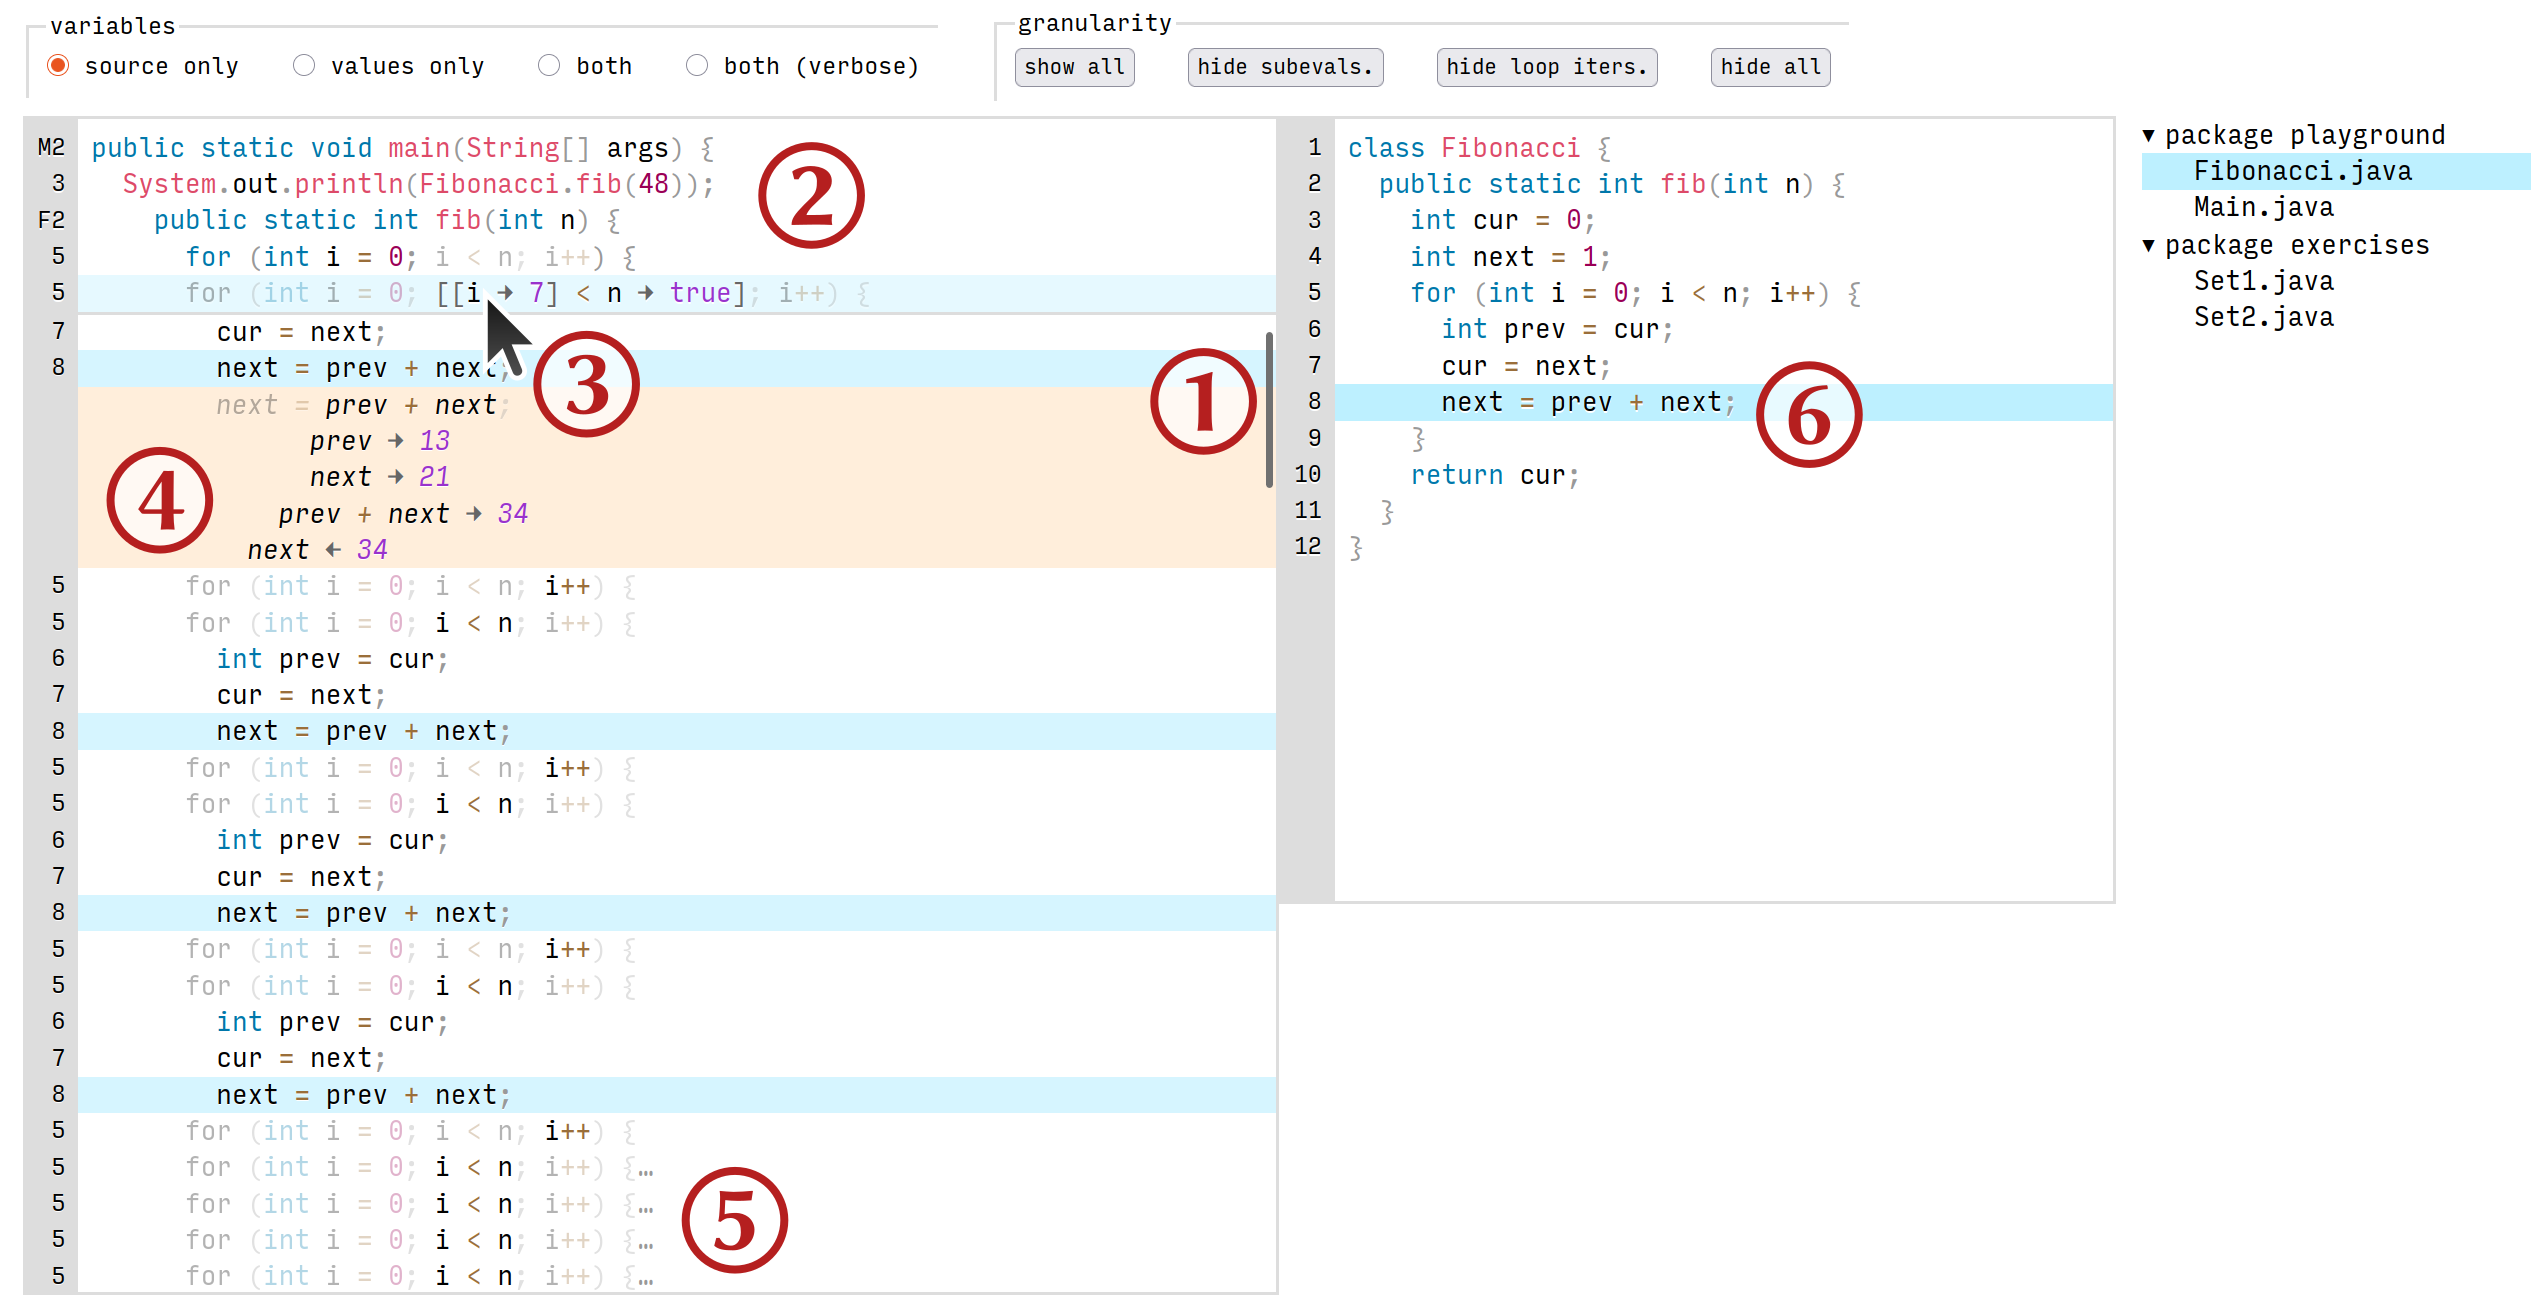
Mockup of our proposed tracer. On the left is the primary trace interface, and on the right, the traditional source code. ① In lieu of stepping, the user freely navigates the trace by scrolling, but can also select a line in the trace and navigate by keyboard if desired. ② As they scroll, a “stack trace” of method and loop headers sticks to the top of the buffer. ③ Hovering over an expression in the trace while pressing Ctrl shows its value and the values of any containing expressions. ④ Subexpression evaluations can alternatively be shown by expanding a statement, and ⑤ loop and method blocks can be collapsed, letting the user control the display granularity. ⑥ Selecting a line in the source code highlights all instances of its execution in the trace, and vice versa. (Pointer icon from Ubuntu Yaru theme, CC-BY-SA.)
Introduction
When a programmer is debugging a program, they are applying the scientific method to understand where and why its observed behavior diverges from their expectations: starting from a working theory of the program’s behavior, they generate a hypothesis, design an experiment that could support or falsify it, conduct the experiment, incorporate the result into their theory, and repeat, until their theory can explain the observed (unexpected) behavior [Zeller2009], [AlaboudiLaToza2023]. At that point, they have “found the bug” and can start trying to fix it. For example,
The working theory (based on previous experiments) might be that the observed wrong output is caused by a wrong counter value.
A hypothesis might be, “The set_counter function is sometimes called with argument value = 0 when it should always be called with value = 1”.
A corresponding experiment might be to add the statement print(value) right at the start of the definition of set_counter and rerun the program, or set a breakpoint on set_counter in a debugger and inspect value.
If the outcome upholds the hypothesis, i.e. the program’s behavior has already diverged from expectations before the observation, then the next hypothesis would probably concern the call sites of set_counter; else it has not diverged yet, and the next hypothesis might concern the usage of value in the method body and further calls.
Beyond debugging, the process above also describes program exploration. A programmer looking to understand an unfamiliar codebase (say, in order to add a feature, or make up for a lack of documentation) may engage in a similar process, as may a student trying to learn a language by studying (not necessarily buggy) example programs. In each case, the user incrementally builds a theory of the program’s behavior based on dynamic observations in addition to static source code.
The two techniques mentioned above—using breakpoints in a debugger, and printf-debugging by adding print statements (or similar)—are well-suited for testing hypotheses. Simple hypotheses about the values of variables, the order of execution of statements, etc. are easy to test with either technique, and more complex ones are possible with some forethought. For example, to investigate the recursion depth of a function, a programmer might set a breakpoint on the base cases and inspect the call stack, or augment the function with a counter argument incremented on every call and printed out from the base cases.
However, neither breakpoints nor print statements directly help the programmer develop hypotheses about the program. If the program seems to run indefinitely, is it because of an infinite loop, or a blocking call to an external resource, or a very expensive computation, or something else? The programmer must rely on their intuition to first choose one of these potential causes to investigate, and to decide where in the code to investigate it, before a breakpoint or print statement can be of help in confirming or refuting the hypothesis.
But what can help a programmer develop hypotheses is observing, over time, a collection of breakpoints or print statements, i.e. stepping through the program in the debugger or logging key points in its execution. Rather than probing at a specific point in time, a programmer might use these techniques to get an overview of the whole execution, and perhaps try to notice where it diverges from their expectations. They come at higher cost, though: step-debugging requires careful planning (conditional breakpoints, and stepping “over”, “into”, “out of”, etc., often with no “undo”) to navigate to the relevant part of the execution and is tricky to reproduce; logging requires manually inserting logging statements and investing effort in making their output useful (selecting what and where to log, indenting or otherwise structuring the log, etc.).
On the left is a program stopped at return sum(things) (in blue) inside a stepper. The stack trace, consisting of compute, do_it, and main, is highlighted in red; but as main is in a different file, the stepper would not display its source code at the same time as that of the other two functions. On the right is the same program in a tracer. (It is not stopped anywhere; it has run to completion. If it had stopped, say, due to an error while computing sum(things), the trace would have been truncated at that point.) Red left arrows mark values passed into function calls or assigned to variables, while blue right arrows mark returned or referenced values. The bodies of initialize and process have been collapsed by the user.
Based on these observations, we propose a new kind of tool for program exploration and debugging—a tracer—that helps the user develop hypotheses about a program. A tracer generates, and then lets the user browse and query, a complete trace of a program’s execution on a given input, recording every statement in order of execution along with the values of any variables and other expressions it contains. Figure 1 shows a web-based mockup we have been working on (discussed in §3.2), while Figure 2 shows a more barebones, plain-text example. Crucially, when the user browses the trace, the y-axis represents time: the statement preceding (following) a given statement is the one that executed just prior (just after), or in other words, code is shown in its temporal context. This is in contrast with a stepper, which shows code in its lexical context and uses real-world time to represent time, controlled with step actions. This also differs from a logger in displaying code instead of custom messages, although both are in temporal order.
In the rest of this paper, we will first describe the limitations of existing stepping and logging tools, and of those approaches in general. Then, we will sketch how a tracer might address those limitations to enable a new mode of exploring and debugging programs. Next, we will briefly report on our ongoing work towards building a practical tracer. Finally, we will conclude with a discussion of related prior work.
Limitations of existing tools and approaches
Existing tools for debugging and program exploration can be classified into steppers and loggers, explained in the subsections below. Both categories have their limitations. Some are inherent to the approach, whereas others could be remedied by an implementation but commonly aren’t.
Steppers
In this section, “steppers” refers to tools that let the user step through the execution of a program, whether or not for debugging purposes. In addition to the source code and the current locus of execution, they may display information such as the current stack trace, the values of local variables, or the standard output and error streams.
- Lexical context-switching obscures temporal continuity.
By design, a stepper shows the current line of code in its lexical context, limited by screen space to typically just the enclosing function definition. Thus, any action that changes the lexical context, such as stepping into or returning from a function call, changes the display entirely and requires the user to context-switch to a different location in the source code—potentially losing track of the temporal continuity of the computation. To reconstruct the temporal context of the current line, i.e. what computations have just happened and what are to happen immediately afterwards, the user must navigate to (or simply remember) previous stack frames.
- Mistakes are costly, inhibiting exploration.
Many steppers cannot fully undo all actions. To restore the previous state of the stepper, the user must restart it and tediously redo their sequence of actions that they must have already kept track of separately. This process can sometimes be sped up by more complex actions like setting conditional breakpoints and watchpoints if the stepper supports them and the user knows how to use them, at the potential additional cost of making and debugging a meta-level mistake (e.g. an incorrect condition). As a result, a user is more likely to think carefully before taking an action; using the stepper feels more effortful and less exploratory.
- Revisiting the past is costly.
Even without making mistakes, the common lack of backwards actions makes it difficult to revisit the past of a computation. Consider a user who, using a stepper, has just confirmed their hypothesis about an erroneous value at some line of code, and concluded that the program has already diverged from their expectations before that line. To test a new hypothesis earlier in the program’s execution, they must often simply restart the stepper, suffering similar costs as described before.
- Stack traces omit looping information (unlike recursion).
A stepper that displays stack traces will show the preceding sequence of recursive calls when stopped inside a recursive function; whereas, inside a loop, it won’t provide any information about previous iterations of the loop. The disparity is even more evident between a tail recursive function and its loop counterpart, where the two computations have the same structure, and may even be identical after optimization.
print, and other loggers
In this section, “loggers” refers broadly to any means of recording information at user-chosen points in the program’s execution, from print statements to full-featured logging libraries.
- Setup cost grows with program size.
The setup cost of logging includes the cost of writing logging statements with all relevant information at all possible places of interest in the program, which scales with the size of the program, in addition to the one-time cost of setting up the logger itself. This is one of the main reasons a user may choose to switch to a stepper after initial exploration or debugging with simple print statements: it is hard to judge whether investing in more structured output from more places in the program will be worth it, or whether they will find what they’re looking for in a few iterations of using the stepper.
- Implicit control flow is hard to understand or query.
Logging records the sequence of actions a program takes but often does not explicitly record control flow. For instance, in Figure 2, suppose do_it logged a message like “computing the result with arguments args” just before calling compute, and compute logged “computation took t seconds” just before returning, and the logger annotated all messages with the name of the function that produced them. A user reading the log must infer that a function call or return occurred between the two messages from the fact that they are annotated with different function names, and must rely on external information (e.g. the source code) to disambiguate the two possibilities. (The user could, of course, choose to log every call, branch, loop, etc. at significant additional setup cost.) As a corollary, being implicit makes control flow hard to query. Continuing the example above, filtering the log to only show output from compute when called from do_it is tricky at best and not unambiguously possible at worst.
The ideal tracer
Recall that our proposed tracer generates, and then lets the user browse and query, a complete trace of a program’s execution on a given input, recording every statement in order of execution along with the values of any variables and other expressions it contains. See Figure 1 and Figure 2 for mocked-up examples. Such a tracer ideally combines the best of steppers and loggers to address the limitations above. Again, some of these improvements are inherent to tracing, and others are enabled by a particular implementation or user interface affordance.
- Code is displayed in its temporal context with concrete values.
By using the y-axis to represent the flow of time during a program’s execution, tracing spares the user the cognitive effort of keeping track of the temporal context across function calls, loops, and other control flow events. Meanwhile, by annotating variables in the trace with their concrete values, tracing retains the benefits of inspecting them in a stepper and makes it easier to follow how data flows through the program. Note that the stack trace at any point can be trivially recovered from the trace as the sequence of enclosing function calls.
- Mistakes are disconnected from program state, hence easy to revert.
By the time a user is interacting with the tracer, the program has already finished running, and its state has been recorded at each point in its execution; there is no “current program state” that could be irreversibly modified by the user’s mistakes. The user only manipulates their view of the trace and associated information, and undoing those actions is a simpler user-interface concern.
- To visit the past (or future), the user simply scrolls up (or down).
Replacing the fixed basic actions of stepping backwards and forwards with the flexible ones of scrolling up and down makes iterated exploratory use easier.
- Looping is as salient as recursion.
Tracing records every executed statement, whether for looping or recursion. A tracer may choose to display the two differently—for instance, displaying iterations of a loop at the same indentation level, but increasing it for recursive calls—but still presents the user with equal amounts of information.
- Setup cost is independent of program size.
Tracing is automatic, and like using a stepper, only requires rerunning (after potentially recompiling) the program, without manually modifying it.
- Control flow is explicit, hence easier to understand or query.
Tracing records every executed statement, including control flow statements, so the trace contains complete, explicit information about the control flow of the program. This makes queries like “show output from compute when called from do_it” possible (but how easy they are to implement can depend on the specific trace format). Plus, a tracer displays program execution as code rather than as messages about the code, making the control flow more directly evident to the user.
Common concerns
There are a number of natural concerns about such a tool, which we address below.
One is that recording, displaying, and querying the trace would present too high a performance overhead to be practical for programs of realistic sizes. To allay this concern, we first note that we see tracers primarily being useful at human scale: individual programmers writing scripts for their own use, a small team building a research prototype, students working on programming assignments. (Multi-threaded or distributed programs are outside our scope.) In these contexts, “realistic” programs rarely exceed a few thousand lines of code, run for more than a few seconds, or use more than a narrow subset of the capabilities of external libraries, if at all. A tracer would not need to scale further to be useful, echoing the philosophy of [KangGuo2017]. Moreover, a back-of-the-envelope calculation suggests that a Python interpreter that executes lines of code per second, running for 2 s, producing 1 kB of trace data per line of code, would produce 2 GB of trace data—while standard stream utilities like grep can process 1 GB of data per second, i.e. can perform simple queries on the trace in roughly the same amount of time it took to generate it. A proper overall evaluation of our tracer would of course include a performance evaluation.
Another related concern is that the trace would overwhelm the user with information. Pending empirical evaluation, we believe some simple features for the tracer’s user interface would go a long way in addressing this concern:
Structural queries about the trace, letting the user search for control flow patterns alongside identifier names and concrete values. For instance, searching for the first iteration of a given loop in which a given variable is assigned the value null; or searching for references to a given variable inside a given recursive function, but not inside its calls to other functions. A drag-and-drop interface could let users compose queries out of basic building blocks, internally representing the query in a tree-based selector language like CSS or XPath that advanced users could edit directly.
Standard browsing utilities like bookmarks (at points of interest in the trace), saved searches, collapsing/expanding conceptual units to control granularity (like function calls or iterations of a loop; see ⑤ in Figure 1), contextual breadcrumbs (see ②), and coarse-grained scrolling through an overview or “minimap” of the trace.
Click-to-inspect records and objects, also letting the user track object identity through the trace. (Primitive values can always be displayed as inline annotations; see ③ and ④ in Figure 1.)
These features can be seen as instances of [Victor2012]’s principles for a “learnable programming” environment, that lets users “follow the flow”, “see the state”, and “create by reacting” (in our case, to “create” would be to refine hypotheses).
A third concern is that users still need lexical context to understand a program. This is easily remedied by showing the source code in a secondary pane beside the trace, and letting the user select a line in the source code to see all instances of its execution in the trace (e.g., line 8 is selected in ⑥ in Figure 1), or conversely, select a line in the trace to bring up its lexical context. Whether having this information helps users more than it distracts them could be an object of evaluation.
Lastly, the description of a program in terms of executed statements and control flow decisions leans imperative in style, and may not work as well for tracing functional code. Functional programs typically have more nested subexpressions, more anonymous intermediate values, fewer named variables, and fewer top-level statements than imperative programs. Yet, it is functional languages that more commonly already have tracing utilities, such as #trace in OCaml [INRIA2025] and trace in Common Lisp [LispWorksLtd.2025], often limited to function calls and return values instead of tracing all subexpressions. This may be sufficient to make tracing useful in practice for those languages, while imperative-style languages might need more detailed traces.
Current progress
Several student projects ([Project:Aebi2024], [Thesis:Kappeler2026], [Project:JolidonKappeler2025], [Thesis:Serandour2024]) that the authors supervised have made initial progress on recording traces of Java programs, along with proof-of-concept user interfaces for browsing those traces. The authors’ work on a full-featured user interface is in early stages and is shown as a mockup in Figure 1.
Acknowledgments
We would like to thank our PLATEAU mentors, Hila Peleg and Joe Gibbs Politz, as well as all the attendees of PLATEAU 2026, for their helpful feedback, abundant pointers to the literature, and enthusiasm about this work.