Practical compositional diagramming
Shardul’s doctoral symposium proposal at SPLASH 2025.
CCS Concepts: • Human-centered computing → Visualization; • Software and its engineering → Software notations and tools.
Keywords: diagramming, diagrammatic notations
© 2025 Copyright held by the owner/author(s). Publication rights licensed to ACM. This is the author’s version of the work. It is posted here for your personal use. Not for redistribution. The definitive Version of Record was published in Companion Proceedings of the 2025 ACM SIGPLAN International Conference on Systems, Programming, Languages, and Applications: Software for Humanity (SPLASH Companion ’25), October 12–18, 2025, Singapore, Singapore, https://doi.org/10.1145/3758316.3762821.
PDF version also available on Infoscience.
Diagrams are rare and hard to work with in programming and theorem-proving environments. Existing diagramming systems do not meet the practical needs of interactive, exploratory use, such as keeping diagrams understandable as they grow in size with limited screen space, or as they evolve as the user steps through the program or proof. My research seeks to develop an approach—compositional diagramming—that meets these needs. Diagrams are formed of independent parts composed in systematic ways reflecting the structure of the represented object, and the diagramming system compiles a higher-level description of the object to lower-level diagram components. Techniques that make diagrams more practical, such as wrapping, folding, and packing, fit neatly into a compositional approach. Through my work, I hope to build a useful diagramming system for working computer scientists, mathematicians, and programmers, based on a better understanding of compositional diagrams.
A tree can be laid out compositionally by horizontally concatenating the layouts of its children (top-aligned), drawing the root node centered above them, and connecting it to the root of each child with an edge.
Prior work has explored techniques to adapt tree layouts to limited space. My work seeks to extend these techniques beyond trees, with a compositional approach, and apply them to meet the needs of exploratory diagramming.
Motivation
Look at the whiteboards of working computer scientists, mathematicians, or programmers, and you will find a variety of diagrams—schematic visualizations of objects and their relationships. Look at their screens, and you will find almost none at all. Despite the intuitive utility of diagrams and the wide range of existing diagramming tools, diagrams are rare and hard to work with in interactive, exploratory contexts like programming or theorem-proving environments.
My research seeks to develop a practical approach to diagramming for such environments. The difficulty lies in their practical needs: diagrams must be easy to specify, adapt to limited screen space, evolve as the user steps through the program or proof, and be easy to follow as they evolve [DiagrammaticNotations+HATRA23]. Addressing these needs will make it easier to work with diagrams on a computer for developing and understanding programs and proofs. It may even put computers at an advantage over traditional media for working with diagrammatic calculi, where reasoning consists of diagram transformations, by avoiding having to redraw or update drawings by hand.
Problem
Existing diagramming systems occupy different points in the tradeoff space between automation, flexibility, ease of use, and other design goals. However, none of them fully meet the practical needs of programming and theorem-proving environments. (Below, I do not consider tools for drawing a single diagram, whether with low-level graphics languages like TikZ/PGF [Tantau2023] or higher-level ones like Bluefish [PollockEtAl2024]. In contrast, diagramming systems produce a diagram from any object in the domain of interest.)
A major design axis of diagramming systems is domain-specific tools vs. general diagramming languages. Domain-specific tools produce high-quality output for specialized domains, like bioinformatics visualizations in Cytoscape. But they are hard to use when the domain keeps evolving and may not even be fully defined, as is often the case during development or exploration. Even for a fixed domain, they are costly to extend when the domain or desired outputs are just outside of what the tool allows, and difficult to compose with existing visualizations. Thus, more general diagramming languages are more appropriate, like Graphviz and its DOT graph language [GansnerNorth2000], Cope-and-Drag [PrasadEtAl2025] for graphs with relative positioning and grouping constraints, or Penrose [YeEtAl2020] for constraint-based graphics for user-specified DSLs.
To be suited for interactive, exploratory use, the diagrams such a system produces must have two further properties [DiagrammaticNotations+HATRA23]:
- Canonicity
Equivalent objects have identical diagrams, and conversely, the object being represented is immediately identifiable from its diagram.
- Continuity
The evolution of the diagram is easy to follow over incremental changes to the object.
None of the diagramming languages in the previous paragraph can ensure these properties, because they do not use structural information about their domain except as constraints for a global layout. Constraint-based layout can too easily leave unwanted degrees of freedom and violate canonicity, or, with tight constraints, be prohibitively expensive. Even when the layout uses some structural information, such as “layers” in the widespread algorithm from [SugiyamaEtAl1981], this structure does not necessarily correspond to the one the user intended, and is outside the user's control. Lastly, constraint-solving can be unstable, and when performed globally, changes in one part of the object can result in changes to unrelated parts of the diagram, violating continuity. Both issues worsen as diagrams grow in size and structure becomes more important for making sense of them.
Approach
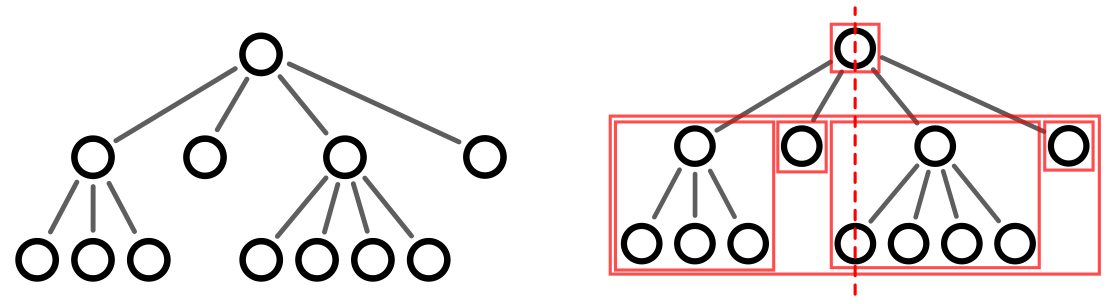
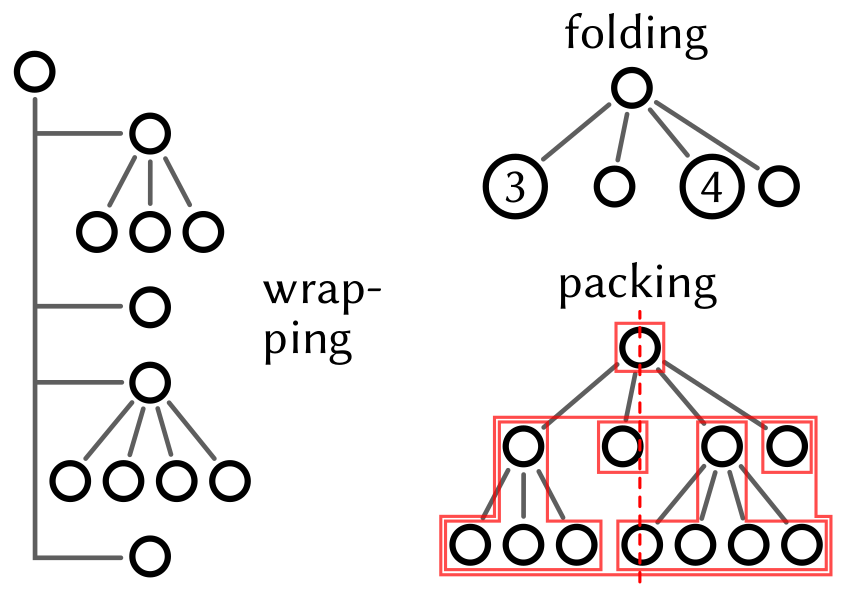
My thesis is that the diagramming language design best suited to programming and theorem-proving environments is compositional: diagrams are formed of parts that have independent meaning, composed in systematic ways reflecting the structure of the represented object (Figure 1). Compositional diagramming has four desirable properties. First, it covers many common classes of diagrams, either by direct structural composition (e.g. trees), or by first identifying a compositional core (e.g. a spanning tree) that determines the structure of the diagram and then adding other components. Second, being structure-driven, it produces diagrams that are canonical by construction. Third, the process of translating a higher-level description of an object to a composition of lower-level diagram components becomes a compilation problem, lending itself to standard techniques. And fourth, a shared compilation target makes it easier to compose different diagram domains, like data structures and the data they contain; and to ensure continuity and adapt to limited space, with common techniques like wrapping (laying out a linear subdiagram in two dimensions), folding (visually summarizing a subcomponent), and packing (keeping fine-grained track of subcomponent contours for better space usage) (Figure 2).
Trees are a common compositional core for diagrams and an important line of study for my research. Many visualizations of data structures, call graphs, proofs, etc. are variants of trees. Tree layout wrapping, folding (and unfolding), and packing have been previously studied, but only in isolation, e.g. [Misue2024], [HanEtAl2024]; how they might cooperate to meet the practical diagramming needs of programming and theorem-proving environments is an unexplored question that I aim to answer. I also plan to develop practical ways to identify an appropriate core tree substructure for diagrams like pointer graphs and program state visualizations.
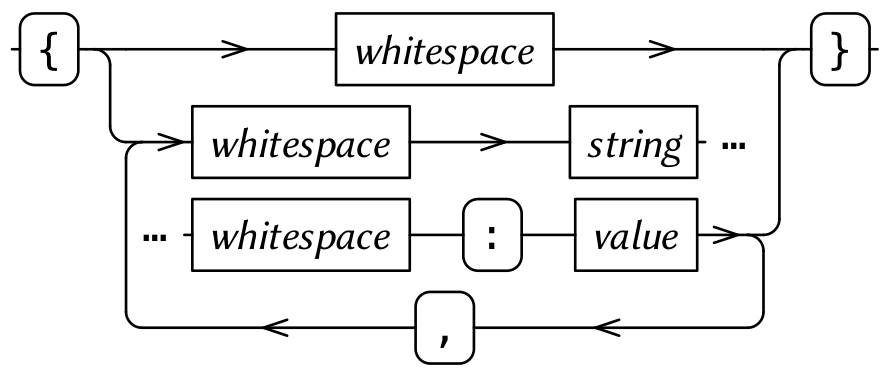
Railroad diagram for the syntax of a JSON object.
I have been studying series-parallel (SP) graphs as another potential compositional core for diagramming. The simplest SP graph is the graph with 2 vertices, the “source” and the “sink”, and 1 edge between them. Two SP graphs can be composed to create a larger SP graph, either in series, identifying the sink of one with the source of another, or in parallel, identifying the sources and sinks of both. An equivalent characterization of SP graphs is as graphs of treewidth at most 2, neatly generalizing trees, which are exactly the graphs of treewidth 1 [BrandstadtEtAl1999], giving reason to believe that SP graphs may be the right core structure for a diagram when trees do not suffice. So far, I have studied railroad or syntax diagrams as one class of diagrams based on SP graphs (Figure 3). Despite being common, intuitive visualizations of formal grammars, their layout had not been studied before; I found that a compositional approach to layout was able to both account for much of the variation in hand-drawn diagrams, including wrapping, as well as make them practical for exploratory use. I plan to investigate how my layout algorithm can extend to other diagrams that I believe have SP graphs as their compositional core, such as control flow graphs and circuit diagrams.
Lastly, I will explore whether there are common classes of diagrams that need compositional cores beyond trees or SP graphs. My first target is string diagrams, a framework for diagrammatic formalism with wide-ranging applications from quantum circuits to finite automata. At face value, string diagrams could be seen as treemap layouts of the underlying algebraic terms (Figure 4). Or, the fact that they are built as series and parallel compositions suggests that SP graphs may be an appropriate core structure. But neither representation allows the intuitive diagrammatic rewriting that makes string diagrams appealing, unlike recent theoretical work on hypergraph representations [PiedeleuZanasi2025].
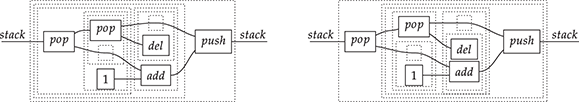
(From [PiedeleuZanasi2025].) Two ways to decompose the same string diagram as a treemap. While useful for layout, such decompositions are tedious for diagrammatic reasoning.
Evaluation methodology
I hope my work will not only result in better understanding of compositional diagramming and techniques to meet practical needs of exploratory environments, but also help me build a prototype diagramming tool that demonstrates these ideas in practice and makes them directly useful to others.
One dimension of success for compositional diagramming is whether the two compositional cores I identified—trees and series-parallel graphs—are sufficient for common domains. Are there domains which have a tree- or SP-graph-like core structure, for which my approach cannot produce the desired diagrams? Or which need a different core structure, or cannot be diagrammed compositionally at all?
Another dimension of success is whether the collection of diagramming techniques that results from my work—including wrapping, folding, and packing, as applied to trees and SP graphs—meets the practical goals of ensuring continuity, adapting to limited screen space, and being performant enough for interactive use. I plan to evaluate these by illustrating existing computerized proof developments in domains amenable to diagramming, such as pointer graphs in separation logic, and by reproducing and extending existing corpuses of diagrams, such as in software documentation.
From a theoretical perspective, my work on series-parallel graph layout in the form of railroad diagrams has connections to two topics with a long history in computer science: pretty-printing (of source code) and structured control flow. I conjecture that most pretty-printing algorithms can be expressed as parameters controlling wrapping and packing in the layout of a railroad diagram, with a series-parallel graph structure over the source code tokens. I also conjecture that structured control flow graphs correspond exactly to those that can be drawn as railroad diagrams. Further, common control flow concepts like tail recursion and non-local exits have elegant diagrammatic representations, and program equivalences can be understood as diagrammatic rewrites. The truth of either conjecture will be evidence for the theoretical value of my approach to SP graph layout.